
Statistical Results Interpretation and Research Results Chapter Review
Statistical results interpretation and results chapter review with clear table explanations, significance reporting, research-question alignment, and accurate academic presentation.
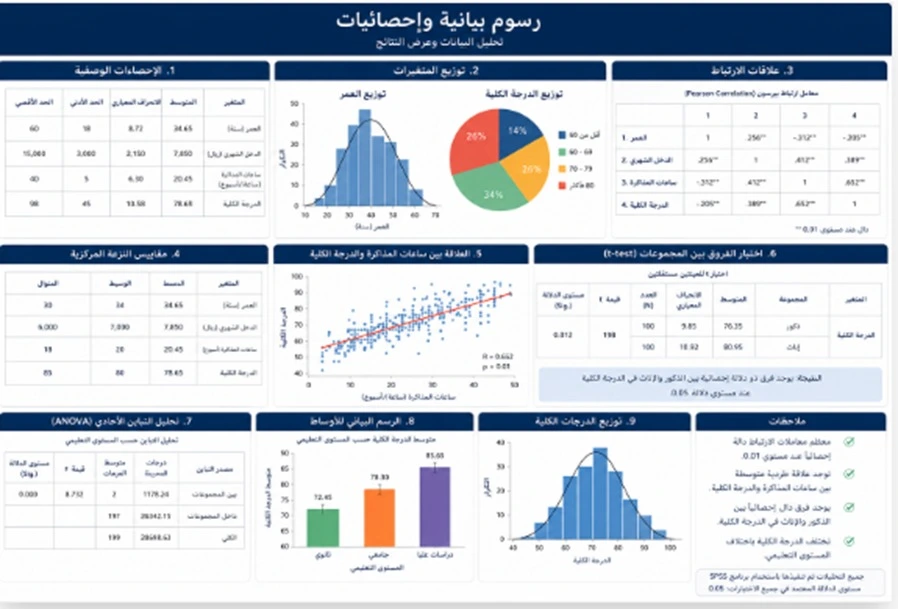
Statistical Results Interpretation and Research Results Chapter Review
Statistical results interpretation and research results chapter review requires much more than copying statistical software tables and writing that a result is significant or non-significant. A strong results chapter connects every finding to a specific research question or hypothesis, presents only the statistics necessary for answering that question, and explains what each value means without going beyond what the statistical test or research design can support. It also distinguishes between reporting a result and discussing why the result occurred. The results section explains what the data showed, while comparisons with previous studies and theoretical explanations are usually presented in the discussion according to the university’s required structure. For this reason, the review process begins by matching research questions with tests and tables, checking figures, headings, significance levels, effect sizes, and confidence intervals where appropriate, and then rewriting the findings in clear academic language that allows the reader to move directly from the research question to the table and then to the conclusion.
Interpreting Statistical Results for Research
Interpreting statistical results for research begins with one basic question: What analysis was performed, and which research question was that analysis intended to answer?
The researcher should not begin with a p-value and then try to discover what it means for the study.
The correct starting point is the research question.
If the question is descriptive, the required interpretation may involve means, percentages, standard deviations, frequencies, or distributions.
If the question concerns differences, the researcher needs to explain which groups were compared, the magnitude of the difference, and the statistical test used.
If the question concerns a relationship, the interpretation should include the direction and strength of the relationship and the relevant coefficient.
If the question is predictive, the researcher needs to interpret the model, the coefficients, and the amount of variance explained.
Each type of analysis therefore requires a different interpretation style.
For example, writing:
“The mean was 4.21”
is not a complete interpretation if the reader does not know:
4.21 out of what?
What does this number represent?
Was the scale from 1 to 5?
What direction do higher scores represent?
Likewise, in a test of differences, writing only:
“There were statistically significant differences”
is not enough.
The reader needs to know:
Between which groups?
In which direction?
How large was the difference?
Was an effect size available?
Statistical significance alone does not indicate the size or practical importance of the finding.
-
Interpretation should begin with the research question rather than with a number found in the statistical output.
-
The type of statistical analysis determines which indicators need to appear in the written result.
-
Statistical significance alone does not explain the size of a difference or the practical meaning of a finding.
Explaining Study Results Tables
Explaining study results tables requires a balance between making the table understandable and avoiding unnecessary repetition of every value in the text.
If a table presents the mean and standard deviation for ten questionnaire items, the researcher does not need to rewrite every number in the paragraph.
It is usually better to focus on the main pattern or the result most closely connected to the research question.
For example:
“The results showed that item (...) had the highest mean, while item (...) recorded the lowest mean.”
The key values that support that statement can then be reported.
If the table is used to test a hypothesis, the written explanation should normally identify:
-
The statistical analysis used
-
The variables or groups involved
-
The relevant test statistic
-
The significance value
-
The direction of the result
-
Effect size or confidence interval where appropriate and available
The title of the table is also important.
Instead of:
Table 7
a clearer title would be:
Mean Satisfaction Scores and Standard Deviations by Academic Level
This allows the reader to understand the purpose of the table before examining its values.
The written text should explain the main message of the table rather than functioning as a complete written copy of it.
-
The text should explain the main message of the table without repeating every value already displayed.
-
Table titles should identify the content and variables as clearly as possible.
-
Every table should serve a genuine research question or finding rather than being included merely because the software produced it.
Reviewing the Research Results Chapter

Reviewing the research results chapter means examining the chapter from beginning to end as a connected series of answers to the research questions rather than as a collection of unrelated tables.
The review should begin by comparing the chapter with:
-
Research questions
-
Research hypotheses
-
Research objectives
-
Analysis plan
-
Methodology chapter
-
Variable names used throughout the study
If the researcher has five research questions, it should be easy to identify where each question is answered in the results chapter.
A common problem occurs when, for example, the third research question asks about the relationship between two variables, but the results chapter only describes those variables without actually reporting the relationship analysis.
The opposite problem can also occur when the chapter includes many additional tables that are not connected to any clear research question or hypothesis.
The review should also examine terminology consistency.
If a variable is called “academic satisfaction” in the instrument, it should not become “study satisfaction” in one section and “student satisfaction level” in another without a clear reason.
Changing terminology can make it appear as though different variables are being discussed.
The sample size should also be checked across tables.
If the number of cases differs from one analysis to another, the reason should be understood, such as missing data or analysis-specific requirements.
-
Every research question or hypothesis should have a clear path through the results chapter.
-
Variable names and terminology should remain consistent between the methodology and results chapters.
-
Any change in sample size between analyses should have an understandable explanation rather than being ignored.
Presenting Statistical Results Academically
Presenting statistical results academically means converting statistical output into accurate, reviewable academic language.
Not everything produced by statistical software needs to appear in the thesis.
The software may generate:
-
Descriptive tables
-
Diagnostic statistics
-
Assumption tests
-
Coefficients
-
Technical output
-
Graphs
-
Warnings
The researcher’s role is to select the output needed to answer the research questions and document the important decisions.
For example, when reporting a test of differences, the final text may need:
-
Group statistics
-
Test used
-
Test statistic
-
Degrees of freedom where relevant
-
p-value
-
Effect size where appropriate
-
Confidence interval where available and relevant
-
Direction of the difference
Copying the entire statistical-software table in its default format, including columns that the reader does not need, is not necessarily stronger academic reporting.
The number of decimal places should also be consistent according to the university guide or required style.
The same value should not appear as 0.4 in one place and 0.4000 in another without a reason.
Effect sizes and confidence intervals can also provide important information beyond traditional significance testing when they are appropriate for the analysis.
-
Only the output needed to answer the research questions should be included rather than copying every table produced by the software.
-
Statistical tables can be reformatted academically when the default software output is not suitable for the thesis.
-
Decimal places and numerical formatting should remain consistent throughout the chapter.
Helping the Researcher Interpret Results

Helping the researcher interpret results should leave the researcher able to understand and explain what happened in the analysis rather than receiving a ready-made paragraph that cannot be defended in front of a supervisor or examination committee.
When a result appears, the important questions include:
Which statistical test was used?
Why was it used?
What does the reported value represent?
What is the direction of the result?
Is the result statistically significant?
How large is the difference or relationship?
What are the limits of the conclusion?
For example, if a positive and statistically significant correlation appears, the researcher can explain that higher values of one variable were associated with higher values of the other within the sample according to the selected correlation coefficient.
It would not be appropriate to write immediately that the first variable “caused” the second.
If a result is not statistically significant, the researcher should not write that “there is absolutely no relationship.”
A more accurate statement is that the data did not provide sufficient statistical evidence for the specified relationship or difference under the selected model and sample.
If the finding is different from what the researcher expected, the result should not be altered or removed to make it fit the hypothesis.
It should be reported as it appeared.
Scientific interpretation of why the finding occurred belongs in the discussion.
Appropriate research support also does not mean inventing a missing value or statistical result.
If a table does not contain enough information for interpretation, the original statistical output or analysis file should be reviewed rather than guessing.
-
The researcher should be able to explain the meaning of the result independently after it has been reviewed.
-
Findings that conflict with expectations should still be reported accurately rather than changed to fit the hypothesis.
-
Missing statistics should not be invented or completed through assumption.
Linking Results to Research Questions
Linking results to research questions is one of the strongest ways to organize a results chapter.
Instead of arranging the chapter according to the order of software procedures such as:
Descriptives, then Correlations, then ANOVA, then Regression
the chapter can be organized according to:
Research Question One
Required analysis and result.
Research Question Two
Required analysis and result.
Hypothesis One
Statistical test and decision.
And so on.
This structure follows the logic of the study more closely.
An internal review matrix can also be created:
This matrix helps identify a research question with no reported result or a table with no clear purpose.
If a main question includes several subquestions, they can be reported in the same logical sequence unless the university guide requires another structure.
-
Organizing results according to research questions makes the logic of the study easier to follow.
-
Every table should have a specific research question or hypothesis that it helps answer.
-
A question-test-table matrix is useful for identifying missing analyses and unnecessary repetition.
Explaining Statistical Significance
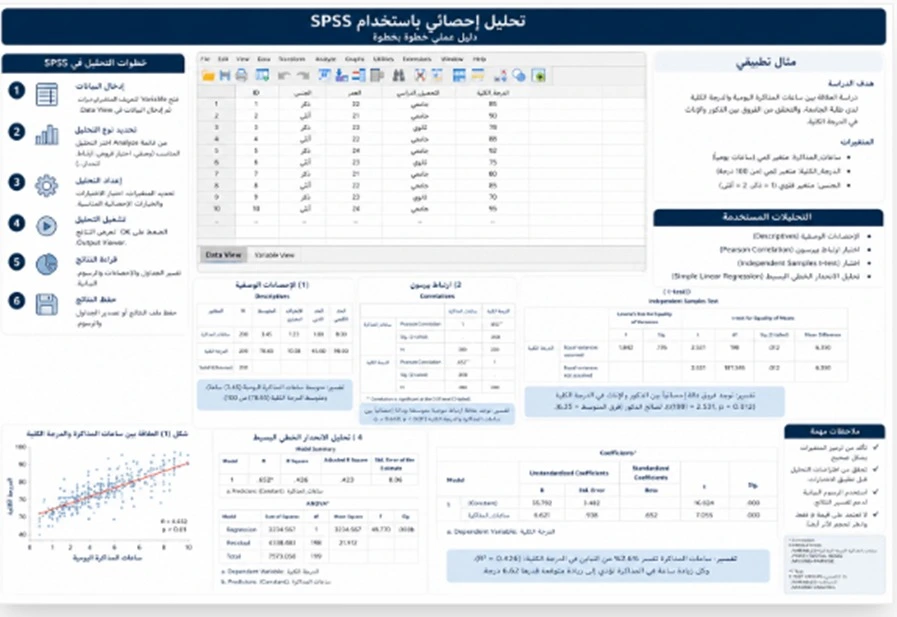
Explaining statistical significance is one of the areas in which results chapters are most often misunderstood.
If a p-value is smaller than a significance level selected in advance, such as 0.05 in many studies, the observed data may be considered less compatible with the null hypothesis under the statistical model and test used.
However, this does not mean:
-
The research hypothesis is 95% likely to be true.
-
The finding is practically important.
-
The effect is large.
-
The relationship is causal.
-
The same result will always appear if the study is repeated.
A p-value does not provide the probability that a hypothesis is true.
It also does not measure effect size.
Scientific conclusions should therefore not be based only on whether a result crosses a fixed numerical threshold.
A non-significant result also does not prove that two variables are identical or that the true effect is exactly zero.
The effect may be small.
The sample may be limited.
The estimate may be imprecise.
Confidence intervals can help show the uncertainty around an estimate, while effect sizes can help describe the magnitude of the difference or relationship when the appropriate measure is available.
An inaccurate interpretation would be:
“Because p = 0.03, the effect is strong.”
A more accurate interpretation would be:
“The test provided statistical evidence of a difference at the predefined significance level, while the magnitude of that difference should be interpreted separately using the observed difference, effect size, and accompanying statistics.”
-
Statistical significance is not the same as practical importance.
-
A p-value does not represent the probability that the hypothesis is true.
-
Effect size and confidence intervals can provide additional information about the finding where appropriate.
Organizing Statistical Tables in a Thesis
Organizing statistical tables in a thesis should allow the reader to understand the result without needing to open the original statistical-software file.
Each table usually needs:
-
Table number
-
Clear title
-
Understandable variable names
-
Clear column headings
-
Units or scales where needed
-
Notes below the table when abbreviations or symbols require explanation
Unnecessary crowding should be avoided.
If a table contains technical columns that the reader does not need, they can often be removed from the thesis version when doing so does not remove information necessary for interpreting the analysis or violate university requirements.
Very small tables should not be divided unnecessarily.
At the same time, extremely large tables containing many columns may need to be reorganized for readability.
Tables can also be ordered according to the logic of the results.
For example:
-
Sample characteristics
-
Descriptive statistics
-
Instrument reliability if included in the chapter
-
Results for Research Question One
-
Results for Research Question Two
-
Hypothesis-testing results
The exact order depends on the study design and university requirements.
It is also essential to ensure that the number reported in the narrative matches the value in the table.
The text should not report 3.74 when the table shows 3.47.
Small inconsistencies like this can reduce confidence in the entire results chapter.
-
Every table should have a clear number, title, and purpose.
-
Technical columns that do not help interpretation can be removed where appropriate, provided necessary information is retained.
-
All figures reported in the narrative should be checked against the tables before submission.
Reviewing the Writing of the Results Chapter
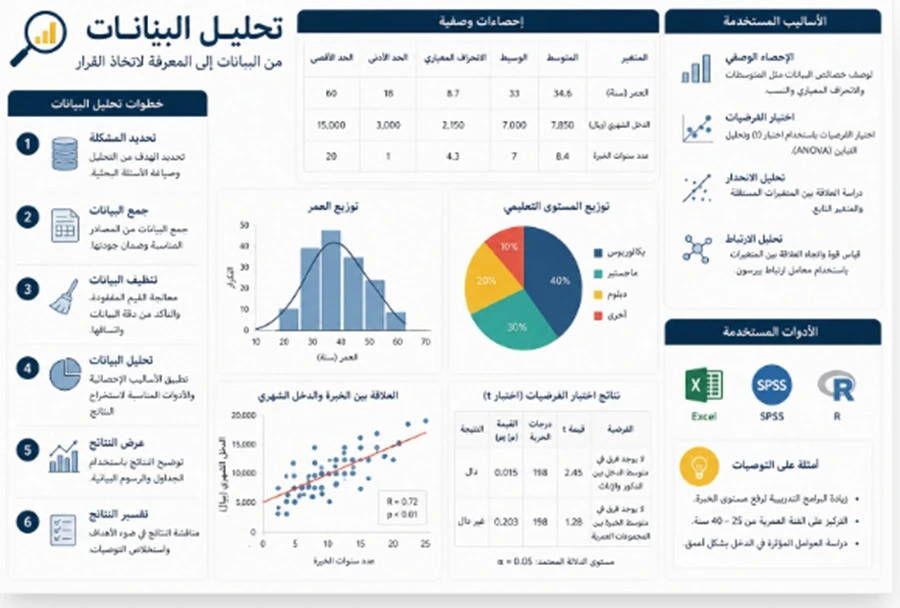
Reviewing the writing of the results chapter involves language, logic, and numerical accuracy at the same time.
Strong results writing is direct.
Instead of writing:
“From the previous table, we can very clearly observe that there are very large statistically significant differences...”
a stronger sentence is:
“The test showed a statistically significant difference between the two groups...”
The necessary values can then be reported.
Statements that contain theoretical interpretation should also be avoided in the results chapter when the thesis separates results from discussion.
For example:
“This may be due to students’ increased awareness...”
is an explanatory statement and would usually belong in the discussion.
By contrast:
“Students in the first group recorded a higher mean than students in the second group...”
is a direct description of the result.
Statistical terminology should also remain accurate.
The term “Pearson correlation coefficient” should not become “correlation percentage” in a way that changes the meaning.
The word “effect” should not replace “relationship” when the analysis and study design do not support causal inference.
-
Results language should be direct and based on what the data actually show.
-
Theoretical explanations and possible causes should generally be reserved for the discussion when the thesis separates the two chapters.
-
Statistical terms should be used precisely rather than replaced with expressions that alter their meaning.
Interpreting Statistical Output Academically
Interpreting statistical output academically means moving from the software interface to research language that a reader can understand.
For example, the software may report:
Mean = 3.84
SD = 0.67
The academic sentence could be:
“The mean score for the variable was 3.84 with a standard deviation of 0.67.”
However, if the scale ranges from 1 to 5, the researcher needs a defined interpretation rule before describing the mean as high, moderate, or low.
That classification should not be invented.
In a correlation analysis, the software may report:
r = 0.42, p = 0.002
A suitable academic interpretation could be:
“The results showed a positive relationship between the two variables, with a correlation coefficient of 0.42. The relationship was statistically significant at the predefined significance level.”
The strength of the relationship can then be interpreted according to the field and methodological framework.
In regression analysis, the researcher may need to interpret:
-
R²
-
F
-
B
-
Beta
-
p
-
Confidence intervals
Each statistic serves a different purpose.
R² should not be confused with the effect size of one predictor.
Beta should not be converted into a “percentage of effect.”
In analysis of variance, a statistically significant overall F test does not by itself identify which groups differ from one another; appropriate post-hoc comparisons may be needed when required.
Good academic interpretation explains what the statistic actually says and what it cannot establish.
-
Every statistical output should be translated into a sentence that preserves its original statistical meaning.
-
Statistical indicators should not be assigned meanings they were not designed to represent.
-
Interpretation should remain within the limits of the statistical test and study design.
What Is the Difference Between Results and Discussion?
This distinction should be clear before reviewing the chapter.
Universities and academic disciplines may divide these chapters differently.
Some theses combine results and discussion.
When that happens, the program or department guide should be followed.
Even in a combined chapter, the researcher should still distinguish conceptually between the finding produced by the data and the explanation added by the researcher.
How Should the Results Chapter Be Organized?
A useful structure in many quantitative studies may include:
Short Introduction
A brief statement explaining what the chapter will present without repeating the methodology chapter.
Sample Characteristics
Where required in the chapter.
Preliminary Analyses
Such as missing-data review, assumption checks, or reliability results when they are part of the reporting plan.
Results for Research Question One
Table followed by focused interpretation.
Results for Research Question Two
And so on.
Hypothesis Testing
Presented according to the order of the hypotheses.
Summary of Major Findings
Where permitted by the university guide.
There is no single mandatory structure for every Saudi university.
The program, college, or department guide and supervisor requirements remain the final reference where they specify a different structure.
Example of Interpreting a Descriptive Table
Consider the following educational example only:
A possible interpretation is:
“Descriptive statistics showed that satisfaction recorded the highest mean among the displayed variables, with a mean of 4.10 and a standard deviation of 0.58, followed by support with a mean of 3.91, while participation had a mean of 3.62.”
However, describing 4.10 as “high” requires an established interpretation rule for the scale if the researcher is using categories such as high, moderate, and low.
That classification should not be added without a defined basis.
Example of Interpreting a Difference Test
Consider an illustrative result:
“The test showed a difference between the two groups in the mean score, with p = 0.02.”
This statement alone is incomplete.
A stronger report would also include:
-
Mean for each group
-
Direction of the difference
-
Test statistic
-
Effect size where appropriate
-
Confidence interval where reported
A general academic formulation could be:
“The results showed a statistically significant difference between the two groups in the variable (...) according to the selected statistical test. The first group recorded a higher mean than the second group. The significance value was (...), with an effect size of (...) where available.”
Only the actual values from the study should be inserted into the final thesis.
Example of Interpreting a Statistical Relationship
If the analysis reports:
r = -0.46
a suitable interpretation could be:
“The results showed a negative relationship between the two variables, indicating that higher values of one variable were associated with lower values of the other within the sample.”
The p-value and confidence interval can then be added if they are part of the reporting requirements.
The researcher should not write:
“An increase in the first variable leads to a decrease in the second.”
unless the study design supports a causal conclusion.
How Should a Non-Significant Result Be Interpreted?
A non-significant finding deserves the same attention as a significant result.
Instead of writing:
“There are no differences.”
it is often more accurate to write:
“The analysis did not provide sufficient statistical evidence of a difference between the two groups at the predefined significance level.”
This distinction matters.
The second sentence makes clear that the conclusion is connected to the sample, test, and uncertainty.
A non-significant result should not be hidden simply because it conflicts with the researcher’s expectations.
Strong scientific reporting includes relevant findings connected to the research questions whether they are significant or non-significant.
Effect Size and Confidence Intervals in the Results Chapter
When the statistical analysis allows it and disciplinary requirements support it, effect size provides information about the magnitude of a difference or relationship.
A confidence interval helps communicate uncertainty around an estimate.
The three concepts can be understood separately:
p-value:
Provides information related to statistical evidence under the selected model.
Effect Size:
Helps describe the magnitude of the difference or relationship.
Confidence Interval:
Helps communicate the precision and plausible range of the estimate.
The appropriate effect-size measure depends on the statistical procedure.
The same effect-size statistic should not be used for every type of analysis.
The requirements of the discipline, university, or journal should therefore be followed.
Common Errors in the Results Chapter
Frequent problems include:
-
Copying statistical-software output without reorganizing it.
-
Failing to connect a table with a specific research question.
-
Repeating every value in the table inside the text.
-
Reporting a number in the narrative that differs from the table.
-
Using different names for the same variable.
-
Treating the p-value as a measure of result strength.
-
Describing a significant result as practically important without evidence.
-
Treating a non-significant result as proof that no effect exists.
-
Turning correlation into causation.
-
Interpreting R² as a percentage of causal influence.
-
Forgetting to report the direction of a difference.
-
Failing to report required post-hoc comparisons.
-
Mixing results with discussion.
-
Including long comparisons with previous studies in the results section when a separate discussion chapter exists.
-
Reporting only statistically significant tables and hiding relevant non-significant findings.
-
Using inconsistent decimal places.
-
Including too many tables that add no useful information.
-
Failing to explain abbreviations.
-
Ignoring missing data or differences in N across analyses.
-
Changing the hypothesis after seeing the result.
Results Chapter Review Checklist
Before submission, the researcher can review the following checklist.
Research Questions and Hypotheses
-
Every research question has a result.
-
Every hypothesis has been tested using the planned analysis.
-
The order of results is logical.
-
No analysis appears without a clear purpose.
Numbers
-
Values match the original statistical output.
-
p-values are reported correctly.
-
Means and standard deviations are accurate.
-
Sample sizes are correct.
-
Positive and negative signs are correct.
Tables
-
Every table has a number.
-
Every title is clear.
-
Column headings are understandable.
-
Abbreviations are explained.
-
Unnecessary columns are removed.
-
Numbers in the text match the table.
Interpretation
-
Every result is linked to the relevant research question.
-
Direction of differences or relationships is reported.
-
Causal claims are not made without justification.
-
Statistical significance is not confused with magnitude.
-
Relevant non-significant findings are also reported.
Writing
-
Unnecessary wording has been removed.
-
The paragraph does not simply repeat the entire table.
-
Language is academic and clear.
-
Results are separated from discussion when required by the thesis structure.
Why Choose Rukn for Results Interpretation and Chapter Review?
At Rukn Translation and Educational Services, support can be defined according to the actual stage and condition of the researcher’s results chapter.
The researcher may need:
-
Review of completed statistical tables
-
Verification of figures against the original output
-
Linking every analysis to the relevant research question
-
Interpretation of statistical significance
-
Review of effect sizes
-
Organization of tables
-
Rewriting results in accurate academic language
-
Separation of results from discussion
-
Review of terminology consistency
-
Complete review of the results chapter before submission
The purpose is not to change the findings until they match what the researcher expected.
It is also not to guarantee that all hypotheses will become statistically significant.
The goal is to present the actual findings accurately and transparently and help the researcher understand and report them in a way that remains consistent with the analysis and thesis requirements.
The researcher remains responsible for the original data, methodology, final academic decisions, and the version submitted to the university.
Steps for Reviewing and Interpreting the Results Chapter
The work can be organized as follows:
-
Receive the research plan, research questions, and hypotheses.
-
Receive the results file, statistical output, and current tables.
-
Match variable names with the methodology chapter and research instrument.
-
Identify the statistical analysis used for every research question.
-
Review the key values in the statistical output.
-
Match written tables with the original software output.
-
Check the number of cases used in every analysis.
-
Identify the main finding for every question or hypothesis.
-
Review the interpretation of statistical significance.
-
Check the direction of differences and relationships.
-
Review or add effect sizes and confidence intervals where required and available.
-
Remove unnecessary repetition between the text and tables.
-
Organize table titles and numbering.
-
Separate results from discussion according to the thesis guide.
-
Review statistical terminology.
-
Review wording used for non-significant findings.
-
Arrange paragraphs according to the order of research questions and hypotheses.
-
Check numerical formatting and decimal places.
-
Verify consistency between tables and narrative text.
-
Conduct a final review of the complete chapter before it is included in the final thesis.
Following these steps allows the researcher to trace every finding from the original research question to the analysis, table, and final written interpretation.
Statistical Results Interpretation and Results Chapter Review Prices
There is no single fixed price for statistical results interpretation and research results chapter review because the scope of work depends on the study.
Factors that can influence the scope include:
-
Number of research questions
-
Number of hypotheses
-
Number of statistical tests
-
Number of tables
-
Types of analyses
-
Size of the statistical output
-
Whether tables are already prepared or need restructuring
-
Need to review SPSS or spreadsheet output
-
Presence of tests of differences
-
Presence of correlation or regression analyses
-
Presence of analysis of variance or multiple statistical models
-
Need for effect sizes
-
Need for confidence intervals
-
Current condition of the results chapter
-
Amount of rewriting required
-
University requirements
-
Supervisor revisions
-
Submission deadline
A chapter containing five descriptive tables is very different from one containing several hypotheses, regression models, analysis of variance, post-hoc comparisons, and tables requiring substantial revision.
For this reason, it is better to provide the research questions, hypotheses, methodology chapter, current results chapter, original statistical output, and any supervisor comments so the review scope can be identified accurately.
Frequently Asked Questions
Should the results chapter contain interpretation or only numbers?
It should contain a direct explanation of what the data show and what the statistical indicators mean in relation to the research question. However, theoretical explanations, reasons for the finding, and extended comparison with previous studies are usually placed in the discussion when the university separates the two chapters.
Do I need to repeat every number in the table in the text?
No. The narrative should focus on the values and patterns that answer the research question, while the table provides the detailed figures. Repeating every cell creates unnecessary duplication.
Is p < 0.05 enough to interpret a finding?
No. The p-value is only one part of the interpretation. The direction of the result, magnitude of the difference or relationship, effect size, and confidence interval should also be considered when those indicators are appropriate and available.
How should I write a non-significant result?
You can state that the analysis did not provide sufficient statistical evidence for the specified difference or relationship at the selected significance level, rather than claiming that the null hypothesis was proven true or that the effect definitely does not exist.
What should I send when requesting a results chapter review?
Send the research questions and hypotheses, the methodology chapter or statistical-analysis section, the current results chapter, the original tables and statistical output, and any supervisor or university comments.
Conclusion
Successful statistical results interpretation and research results chapter review does not depend on the number of tables or on producing the largest possible number of statistically significant findings.
A strong chapter begins with the research questions.
Each question is linked to the appropriate analysis.
The original statistical output is then reviewed.
Only the necessary tables are selected.
The findings are interpreted in clear academic language that explains direction, magnitude, significance, and uncertainty to the extent supported by the analysis.
The result is separated from theoretical explanation where the thesis structure provides a separate discussion chapter.
The figures reported in tables and narrative are checked carefully, and relevant non-significant findings are explained rather than hidden.
The researcher also avoids converting an association into causation or treating a p-value as a measure of result strength.
The final objective is to allow the reader to move easily from the research question to the statistical table and then to the conclusion without contradiction, exaggeration, or ambiguity.
If you already have statistical output or a written results chapter and need the tables interpreted, findings linked to research questions, and the wording and numerical values reviewed before submission, prepare the research questions, hypotheses, current results chapter, original statistical output, and any supervisor comments, then contact Rukn Translation and Educational Services to determine whether you need results interpretation only, table and writing review, or a complete review of the results chapter before the final version is submitted.
Need Help?
Contact us directly via WhatsApp and we will reply as soon as possible.
More Articles
Online Saudi Math Tutor by School Stage and Curriculum
Online Saudi math tutoring tailored to the student’s school stage and level, from foundations and lesson explanation to problem solving and exam review.
Read Article → Research Project AnalysisProfessional Project Dashboard Design in Spreadsheets
Professional project dashboard design with KPIs, charts, filters, interactive reports, and visual tracking to monitor results, progress, and project performance.
Read Article → Data ProcessingResearch Data Cleaning in Spreadsheets Before Statistical Analysis
Research data cleaning before analysis, including missing values, duplicates, errors, outliers, spreadsheet organization, and accurate database preparation.
Read Article →