
Survey Data Coding and Preparation for Statistical Analysis
Survey data coding and preparation for statistical analysis, including variable definitions, missing data, reverse-coded items, data cleaning, and organized research datasets.

Survey Data Coding and Preparation for Statistical Analysis
Survey data coding and preparation for statistical analysis begins before any statistical test is performed because statistical software does not automatically know whether the number 1 represents male, strongly agree, or a missing response. Every value needs a clear definition, every question needs an organized variable, reverse-coded items require correct handling, and missing values must be distinguished from genuine responses. An error at this stage can move into means, tables, and statistical tests and produce results calculated from incorrectly coded data. Strong preparation therefore begins with the original questionnaire, followed by creating a variable dictionary, entering or importing responses, checking ranges, duplicates, and logical consistency, and producing a clean dataset ready for analysis while preserving the original raw data without modification.
Survey Data Coding

Survey data coding means converting responses into organized values or categories that both the researcher and statistical software can use without losing the original meaning of the question.
However, coding does not simply mean replacing words with numbers.
Before assigning a number to any response, the researcher needs to understand the question type and what the number actually represents.
For a question such as academic level, numbers can be used to represent categories, but the number is primarily a code for the category rather than necessarily a quantitative value.
If first year is coded as 1, second year as 2, and third year as 3, this does not automatically mean that the statistical distance between 1 and 2 is equivalent to the distance between 2 and 3 for every type of analysis.
For a binary question such as “Yes / No,” a clear and consistent code can be assigned to each response, provided that the meaning of each value is documented in the data dictionary.
A graded response scale requires an additional decision about score direction.
Does the higher score always represent a more positive response?
Are there reverse-worded items?
Is the same coding direction used across all dimensions?
One serious mistake is allowing the meaning of the same number to change from one question to another without documenting the difference.
If the value 1 means “strongly agree” in one dimension and “strongly disagree” in another, the dimension scores may be calculated incorrectly unless the difference is intentional and clearly recorded.
-
Every numerical code should have a clearly documented meaning in the variable dictionary
-
Numbers used to represent categories do not automatically transform a nominal variable into a quantitative one
-
Response-scale direction should be standardized or clearly documented before dimension scores are calculated
Preparing Research Data for Analysis
Preparing research data for analysis means moving the file from the stage of “responses that have been collected” to the stage of “data that can be relied upon for analysis.”
At the beginning, it is preferable to preserve a raw copy of the dataset exactly as it was exported from the data-collection form.
This version should not be edited directly because it represents the original source that the researcher can return to if a discrepancy appears later.
A separate working copy can then be created for cleaning and coding.
Within the working file, column names, questions, and values can be reviewed.
If a question appears as an extremely long sentence, it may be assigned a shorter and more organized variable name while preserving a complete description that records the original wording of the question.
The range of possible values should then be examined.
If a question uses a five-point scale, the researcher should check whether the file contains any values outside that range.
Questions involving skip logic or conditional paths should also be reviewed.
For example, if the first question asks, “Have you ever used the service?” and the participant answers “No,” yet the participant later has detailed responses about frequency of use even though the questionnaire design was supposed to skip those questions, the case requires review.
Missing values should also be examined.
A blank cell does not always mean the same thing.
It may represent a question the participant chose not to answer, or it may represent a question the participant was never expected to answer because of the questionnaire path.
Distinguishing between those situations can be very important.
-
The raw dataset should be preserved as an original file separate from the cleaning and analysis files
-
Every modification to the data should ideally remain traceable rather than changing values without recording the reason
-
Blank values caused by legitimate skip logic may differ from missing data caused by non-response
Entering Questionnaire Data
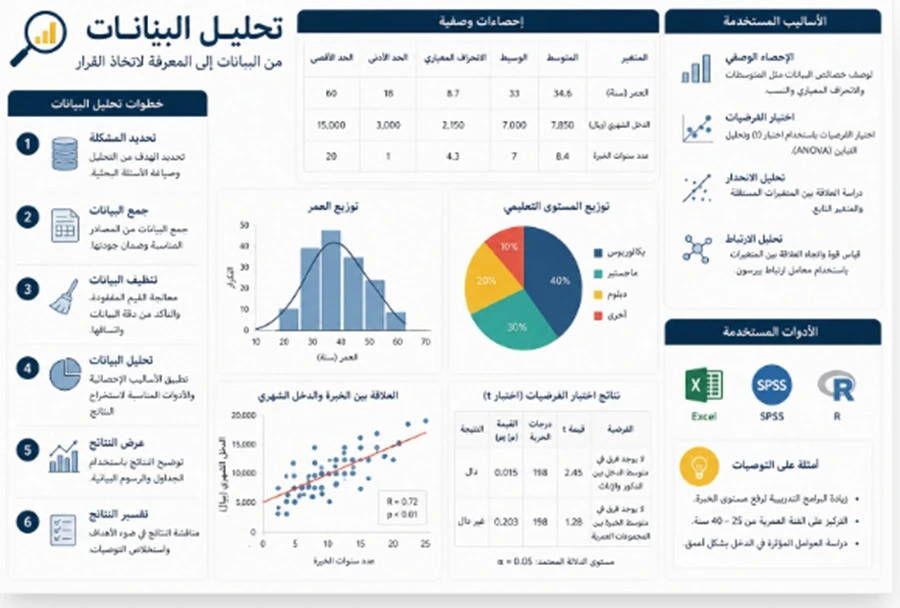
Entering questionnaire data requires a consistent system, especially when responses come from paper forms or multiple data sources.
For many questionnaires, it is practical for each row to represent one participant or case and each column to represent one variable or item, although the final file structure should always reflect the nature of the research and the type of data.
Before manual data entry begins, a clear template should be created.
The template should contain the variables arranged according to the questionnaire sequence or another well-designed order that makes review easier.
Values can then be entered according to the agreed coding system.
When responses come from an electronic form, this reduces the amount of manual data entry but does not eliminate the need for review.
An exported file may contain timestamps, long question labels, technical fields, and text responses that need preparation before analysis.
Researchers should also avoid changing an original response simply because it appears unusual.
If a participant selected an unexpected answer that was still one of the permitted options, it remains a real response unless there is a documented methodological reason for excluding it.
Clear data-entry errors, such as entering 55 instead of 5, should ideally be checked against the original source before correction whenever possible.
For large manually entered datasets, a sample of rows can be checked against the original questionnaires or source records to detect systematic entry errors.
-
The data-entry template should be defined before transcription begins so the recording method does not change halfway through the process
-
Electronically imported data still require review even when there was no direct manual entry
-
An unexpected value should not be changed merely because it is inconvenient for the researcher if it is a genuine and valid response
Defining Study Variables
Defining study variables creates the connection between the questionnaire, the research plan, and the dataset.
A column name by itself is not enough.
The researcher needs to know what the variable represents, how it was measured, and what values can legitimately appear.
A variable definition can include:
-
Variable name used in the dataset
-
Original question or item wording
-
Short variable description
-
Response type
-
Coding values and their meanings
-
Missing-value code where applicable
-
Whether the item is reverse-coded
-
Dimension or scale to which the item belongs
-
Scoring method if the item contributes to a composite measure
This set of information forms what can be called a data dictionary or variable guide.
Having this dictionary becomes particularly important when the questionnaire is long.
Two months after data collection, a researcher may no longer remember whether Q17 belonged to satisfaction or ease of use, or whether the value 1 represented the highest or lowest response category.
The dictionary prevents the analysis from depending on memory.
It also helps when the dataset is shared with another analyst because that person does not need to guess what the columns mean.
Variable definitions should also remain consistent with the thesis itself.
If a dimension name changes during methodology writing, the researcher should check that the variable names, files, and later analysis reflect the final version.
-
A data dictionary preserves the meaning of every variable and its coding system instead of relying on short and unclear column names
-
Variable definition connects the dataset column to the original question dimension and measurement method
-
Any change in the instrument or dimensions should be reflected in the data dictionary so two different versions of the same meaning do not remain in circulation
Coding Participant Responses
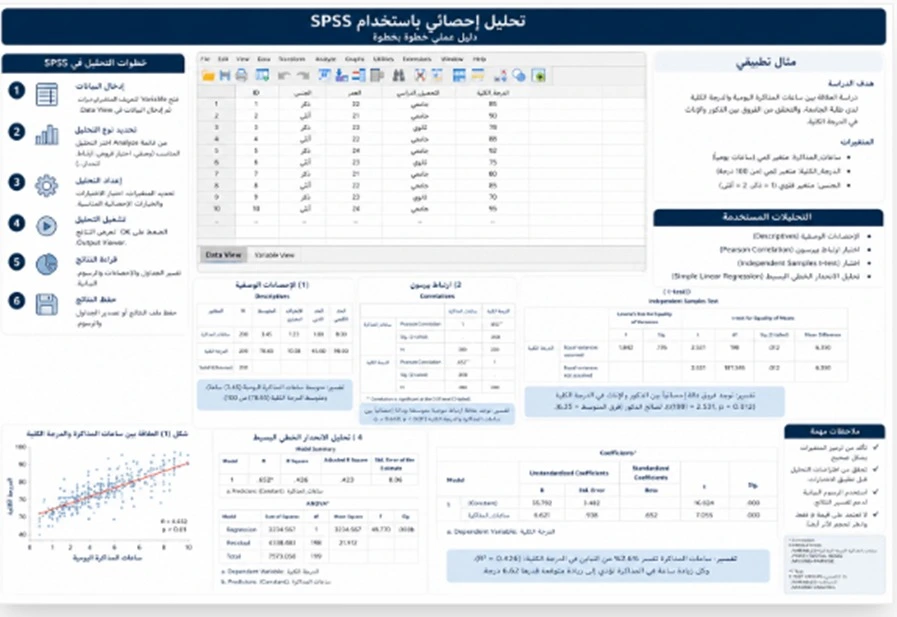
Coding participant responses requires different rules depending on the question type.
Binary questions are usually relatively straightforward to code.
Questions with several mutually exclusive categories can be assigned one code for each category.
However, questions that allow participants to select more than one response need different handling.
If a question says, “Select all sources you use,” placing every possible combination into a single variable is not always the most practical approach.
In many research designs, it is clearer to create a separate variable for each option that records whether that option was selected, depending on the analytical plan and structure of the question.
Open-ended responses should not be converted into numbers arbitrarily.
If the researcher intends to conduct content analysis, categories should first be developed with clear coding rules before the text is classified.
The original written response can remain in the file alongside the coded category so the classification can be checked later.
“Other, please specify” questions also require preservation of the original text and a review of whether some responses can reasonably be incorporated into an existing category or require a separate category.
A new category should not be created after seeing the results simply because it produces a more convenient distribution.
Classification rules should remain as logical and consistent as possible.
-
A multiple-response question may require several variables so every selected option can be represented in an analyzable form
-
Open-ended responses need a clear coding framework if they are going to be converted into numerical categories
-
Original text should preferably be retained when coding open-ended responses so the accuracy of classification can be reviewed later
Preparing the Statistical Data File
Preparing the statistical data file involves creating a dataset that remains understandable even if the researcher opens it months later or another analyst needs to use it.
Random names such as “Q1” and “Q2” may be sufficient in a very small dataset, but they quickly become confusing in questionnaires containing dozens of items and dimensions.
A clear naming system is preferable.
For example, variable names can reflect the dimension and item number in a concise form while the full question wording is retained in the data dictionary.
Columns should also be organized in a logical way.
The file may begin with a case identifier, followed by basic variables, then questionnaire items grouped by dimension.
However, there is no single mandatory order for every study.
The important point is clarity and consistency.
Original variables should also be distinguished from calculated variables.
If a total or average dimension score is created from several items, it should have a clearly different name from the original item variables.
Likewise, if age is transformed from a continuous number of years into categories, it is usually useful to retain the original age variable alongside the newly created categorical variable unless a different methodological requirement applies.
This protects the original information from being lost.
The data type of each variable inside the statistical software should also be checked.
Some variables are numerical, some are text, and dates have their own data structures.
An incorrect data type may create problems during sorting, calculation, and later analysis.
-
Variable names should be organized in a way that makes the file understandable instead of relying on vague labels
-
Calculated or recoded variables should remain clearly separated from the original variables so the initial value can still be recovered
-
The data type of each variable should be defined according to the actual nature of the information rather than only the appearance of the value
Converting a Questionnaire into Numerical Data
Converting a questionnaire into numerical data does not mean that every question has to become a number in any available way.
The goal is to create an appropriate representation of each response that preserves its meaning and supports the intended analysis.
For a graded response scale, numerical values may represent response levels when this is part of the instrument design.
For nominal variables, such as region or academic specialization, numbers may be assigned only as storage and analysis codes.
The number in this situation still functions as a coded label for the category.
It would therefore be inappropriate to calculate the mean of the numerical codes assigned to academic specializations and interpret that mean as though it were a meaningful quantitative value.
Similarly, an internal participant identification number is not itself an analytical variable.
It is simply an identifier that helps distinguish one row from another.
Questions that record actual counts, age, scores, or other quantities contain numerical information with a different meaning.
The researcher therefore needs to understand the measurement level rather than assuming that every column containing numbers represents the same type of variable.
Dates also require attention.
A date of birth may be used to calculate age when necessary, but preserving the complete date may provide more identifying information than the study actually needs.
If the research only requires age, the need to retain more detailed personal information should be reviewed according to study and privacy requirements.
-
Converting words into numerical codes does not alter the original measurement level of the variable
-
A participant identifier should be used to organize cases and should not be treated as a quantitative research variable simply because it contains numbers
-
Personal information should be retained only to the extent necessary for the research and according to applicable study and privacy requirements
Reviewing Variable Coding
Reviewing variable coding takes place before final analysis to confirm that the definitions recorded in the data dictionary match the values actually stored in the file.
One simple first check is to generate frequency distributions.
If a variable is supposed to contain values from 1 to 5 and a value of 7 appears, that is a signal requiring investigation.
If a gender or specialization variable contains a value that has no definition in the coding dictionary, the researcher needs to determine where it came from.
Reverse-coded items should then be reviewed.
A reverse-coded item is not simply an item that sounds negative linguistically. It is an item whose scoring direction needs to be handled according to the scoring rules of the instrument.
Recoding should preferably be performed into a new variable or through a documented procedure that allows the original response to be recovered.
The researcher should also make sure that missing-data codes have not been confused with genuine responses.
If 99 is used to represent missing data, 99 should not also be a valid possible value for that variable.
Statistical software can define missing values or handle them in a way that fits the analysis plan rather than treating the missing-data code as an ordinary number that enters calculations.
Logical consistency between variables should also be checked.
If a participant reports never having used a particular service but still has ten detailed responses about experience using it, the issue may involve questionnaire routing or data entry and deserves review.
-
Frequency distributions and range checks are among the simplest ways to detect unexpected codes before statistical testing begins
-
Reverse-coded items should be recoded through a documented process while preserving access to the original values
-
Logical consistency checks between variables can identify problems that are invisible when each column is reviewed separately
Building the Research Database

Building the research database requires attention to organization, accuracy, and protection at the same time.
First, directly identifying information, where it exists and is genuinely necessary, can be separated from the analytical dataset when the study design allows this.
In many studies, the analysis file does not need the participant’s name or phone number.
An internal identifier can be used for legitimate linkage purposes when necessary.
Second, different file stages should be preserved.
A raw version.
A cleaned version.
And, where appropriate, an analytical version containing derived or calculated variables.
Clear version naming helps prevent the researcher from analyzing the wrong file.
It is better to avoid a sequence of file names such as “final,” “final2,” and “final-last” when it is unclear which one is actually approved.
A date or version number can provide a clearer system.
Third, the data dictionary and cleaning notes should be preserved alongside the dataset.
If a case is excluded, the reason should be recorded.
If two categories are merged, the decision should be documented.
If a new variable is calculated, the calculation method should be recorded.
This makes the preparation process reviewable.
It also helps the researcher later when writing the methodology chapter because they can describe what was actually done instead of trying to remember the procedures months later.
-
A strong research database includes the dataset itself together with the variable dictionary and a record of important modifications
-
Separating raw data from the cleaned dataset reduces the risk of losing the original responses or modifying them without a way to recover the original state
-
Clear file-version names help prevent statistical analysis from being conducted on an outdated or incomplete dataset
Preparing Data Before Statistical Tests
Preparing data before statistical tests represents the final checkpoint before descriptive and inferential analysis begins.
At this stage, the researcher confirms that the dataset is genuinely ready to answer the research questions.
The final number of cases should be checked.
If 350 responses were collected but only 327 will be analyzed, it should be clear what happened to the remaining cases.
Were they duplicates?
Substantially incomplete?
Ineligible according to the sampling criteria?
Cases should not be deleted merely to obtain a different result.
Missing values and the selected method for handling them should then be reviewed.
Reverse-coded items and dimension scores should also be confirmed.
If a dimension consists of six items, the researcher should verify that the correct six items were used in the calculation and that they were scored in the correct direction.
Initial distributions and descriptive summaries can also be examined to identify unexpected values before formal statistical testing.
However, data cleaning does not mean modifying the data until they become “perfect.”
An outlier may represent a genuine participant.
Before deleting or modifying an unusual value, the researcher should understand its source, its impact, and the appropriate methodological approach.
Finally, the dataset should be matched once more against the research questions.
Are all required variables available?
Are the group labels understandable?
Is the scoring procedure for every derived measure documented?
If the answer is yes, the file can move into the analysis stage instead of trying to repair coding problems while statistical results are already being produced.
-
The final analytical sample size should be clearly explained when it differs from the number of responses originally collected
-
Preparing data does not mean deleting every unusual value to make the results appear cleaner or more statistically significant
-
Before statistical tests begin every variable required by a research question should exist and be coded and calculated correctly
What Is the Difference Between Raw Data, Cleaned Data, and the Analysis File?
Confusing these files is one of the most common causes of problems in research projects.
Keeping these files separately is not unnecessary complexity.
It is a way to protect the integrity of the research.
If the researcher discovers a month later that one reverse-coded item was handled incorrectly, they can return to the original data and repeat the step instead of losing the real responses.
What Should a Data Dictionary Include?
A data dictionary does not need to be complicated, but it should remove ambiguity.
Useful elements can include:
A clear dictionary can save considerable time during analysis and review and reduce the risk of interpreting a column incorrectly.
How Should Reverse-Coded Items Be Handled?
A reverse-coded item should be reviewed according to the scoring method of the original instrument.
If higher scores on most items represent a higher level of the construct while one item is worded in the opposite direction, that item may need to be recoded before being combined with the rest of the dimension.
However, not every negatively worded sentence automatically requires reverse coding.
The reference point should be the instrument design and scoring instructions.
On a five-point scale, reverse coding changes the direction of the values according to the scale rules, but the original raw column should preferably remain unchanged.
A separate recoded variable can be created or the procedure can be performed in a documented manner.
The researcher should then confirm that the new score is now aligned with the intended direction before calculating a total or mean score.
One mistake in this stage can affect the entire dimension score.
How Should Missing Data Be Handled?
Missing data are not all the same.
A participant may leave one item unanswered.
A question may not apply because the participant followed a skip path.
A value may also be lost because of a technical problem.
The first step is therefore to understand the reason for the blank value where possible.
The researcher can then determine how it should be recorded and handled according to the analysis plan.
It is not appropriate to automatically replace every missing value with the mean because the appropriate strategy depends on the amount and pattern of missingness, variable type, and analysis being performed.
Similarly, using zero to represent missing data can create a problem when zero is itself a legitimate response.
The basic principle is that missing values should remain clearly distinguishable from actual responses.
Common Errors in Survey Data Coding
Preparation errors sometimes remain hidden until an unexpected statistical result appears.
Common problems include:
-
Reversing the meaning of 1 and 5 between dimensions without documenting the difference.
-
Forgetting to recode a reverse-worded item.
-
Using zero as a missing-data code when zero is a valid response.
-
Placing a multiple-response question in one cell in a format that is difficult to analyze.
-
Deleting original open-ended text after categorizing it.
-
Using several names for the same variable.
-
Converting age into categories and deleting the original value unnecessarily.
-
Combining categories after seeing the results without justification.
-
Changing a real response because it appears illogical to the researcher.
-
Deleting cases without recording the reason.
-
Mixing the raw file with the cleaned dataset.
-
Calculating a dimension score from the wrong items.
-
Failing to update the data dictionary after coding changes.
-
Entering numbers as text in some rows and as actual numeric values in others.
-
Running statistical tests before completing range and value checks.
One coding error can spread across dozens of tables, which makes correcting it at the preparation stage much easier than discovering it after the results chapter has already been written.
Why Is Data Preparation Separate from Statistical Analysis?
Because selecting the correct statistical test cannot repair a dataset that was coded incorrectly.
If a reverse-coded item enters the analysis in the wrong direction, the software will use the value it receives.
If a missing-data code is treated like an actual response, the program may include it in the mean.
If categories are combined incorrectly, the test will compare groups that do not accurately represent the original responses.
For this reason, the process can be divided into three stages:
Data Collection → Data Coding, Preparation, and Cleaning → Statistical Analysis.
Each stage depends on the accuracy of the stage before it.
This is why a clean dataset and a clear variable dictionary are among the most important outputs of the preparation process.
Why Choose Rukn for Survey Data Preparation?
At Rukn Translation and Educational Services, the work scope can be determined according to the actual condition of the data rather than moving directly to statistical tests.
The responses may still be stored in a raw electronic export that requires column organization.
Another researcher may have a manually entered dataset that needs coding and range checks.
In another case, the main problem may involve reverse-coded items, dimension scoring, or multiple-response questions.
The researcher may also need a clear variable dictionary before sending the dataset for statistical analysis.
The goal at this stage is not to produce a particular statistical result.
The goal is to prepare a database that reflects the collected responses as accurately and transparently as possible.
Participant responses should never be altered, nonexistent responses should never be added, and cases should not be removed simply to influence the result.
The researcher remains responsible for the integrity of data collection and for the scientific decisions related to the instrument and sample.
Steps for Coding and Preparing Survey Data
The work can be organized through the following stages:
-
Receive the final questionnaire and response file.
-
Compare the response file with the instrument to confirm that all questions and variables are present.
-
Create and preserve a raw copy that will not be modified.
-
Create a variable dictionary explaining names questions values and meanings.
-
Define the coding method for every question.
-
Review multiple-response and open-ended questions and determine how they will be represented.
-
Identify missing values and distinguish different types where necessary.
-
Identify reverse-coded items according to the approved instrument.
-
Check value ranges to identify impossible entries.
-
Review duplicate cases and logical inconsistencies without automatic deletion.
-
Create recoded variables or calculated scores while documenting the procedure.
-
Review the final number of cases and document the reason for any exclusions.
-
Update the data dictionary after all modifications.
-
Save clearly named cleaned and analysis-ready versions.
-
Complete a final dataset check before statistical tests begin.
Following these steps makes the transition from questionnaire responses to statistical analysis traceable and allows the researcher to understand exactly how every response became the value stored in the final dataset.
Survey Data Coding and Preparation Prices
There is no single fixed price for survey data coding and preparation for statistical analysis because the workload changes according to the condition of the dataset and the complexity of the instrument.
Factors that can affect the service scope include:
-
Number of participants.
-
Number of questionnaire items.
-
Whether the responses are electronic or paper-based.
-
Need for manual data entry.
-
Number of dimensions.
-
Presence of reverse-coded items.
-
Number of open-ended questions.
-
Multiple-response questions.
-
Amount of missing data.
-
Need to build a variable dictionary from the beginning.
-
Presence of data-entry errors.
-
Need to create dimension scores.
-
Presence of more than one questionnaire version.
-
Amount of review required before analysis.
-
Required delivery deadline.
A well-organized file exported from an electronic form is different from hundreds of paper questionnaires requiring data entry and verification.
Likewise, a questionnaire containing simple closed questions differs from a multidimensional scale containing reverse-coded items, open-ended questions, and derived variables.
For this reason, it is better to provide the questionnaire, current response file, dimension definitions, and scoring instructions where available so the actual work scope can be determined before pricing.
Frequently Asked Questions
Is data coding the same as statistical analysis?
No. Coding and preparation come before statistical analysis. At this stage, responses are organized, variables are defined, the dataset is cleaned, and its readiness is checked. Statistical tests and result tables come afterward.
Do all questionnaire responses need to be converted into numbers?
No. The appropriate representation depends on the question type and the planned analysis. Some open-ended responses may remain as text, while category variables may use numbers only as codes without becoming quantitative variables.
Can I change an unusual value in the dataset?
A genuine response should not be changed simply because it appears unexpected. If the value is clearly a data-entry error, the best approach is to return to the original source where possible and document the correction.
What should I do with missing values?
The researcher should first identify their reason, type, and extent, then choose an appropriate handling method according to the study and analysis. There is no single method that is correct for every dataset.
What should I send when requesting data preparation?
Send the final questionnaire, response file, dimension definitions, current coding method where available, and any instrument instructions or supervisor comments.
Conclusion
Successful survey data coding and preparation for statistical analysis is not measured by how quickly responses are converted into numbers.
The real value appears when every number in the file has a known meaning, a clear source, and a documented coding method.
The questionnaire becomes a set of variables.
The variables receive names and definitions.
Responses are transformed into appropriate values without losing their meaning.
Reverse-coded items are reviewed.
Missing values are not allowed to enter calculations as though they were genuine responses.
The raw file remains preserved.
The cleaned file remains reviewable.
And before the first statistical test is run, the researcher knows exactly what every column and every value in the database represents.
This stage is the bridge between collecting responses and conducting statistical analysis, and an error here can move directly into the findings even when the statistical test itself is completely correct.
If you already have a questionnaire with collected responses but the dataset still needs data entry, coding, cleaning, or a variable dictionary, prepare the final version of the instrument, the current response file, and the dimension-scoring method where available, then contact Rukn Translation and Educational Services to determine whether you need data entry, coding review, a clean analysis-ready file, or a complete research database prepared for the next stage of statistical analysis.
Need Help?
Contact us directly via WhatsApp and we will reply as soon as possible.
More Articles
Research Hypothesis Testing and Choosing the Right Statistical Test
Research hypothesis testing and statistical test selection based on variable type and study design, with accurate interpretation of significance, effect size, and results.
Read Article → Data ProcessingCronbach's Alpha Reliability Testing and Result Interpretation
Cronbach’s alpha reliability testing with internal consistency analysis, item review, result interpretation, and clear limits for use in academic research.
Read Article → Research Project AnalysisStatistical Survey Analysis and Results Interpretation for Researchers
Statistical survey analysis with data cleaning, test selection, table preparation, and clear interpretation of results linked directly to research questions and hypotheses.
Read Article →